We often hear about “luck” and “customer friendly results” at earnings announcements times. But luck is not a strategy.
The true heartbeat of a sportsbook’s P&L is Structural Hold: the mathematical advantage baked into the product mix before the first whistle blows.
To understand why the US OSB industry’s GGR (Gross Gaming Revenue) hold rate is climbing over time, from the traditional 5-6% to the 9-11% range, we must look under the hood at the handle mix by bet type, expected or theo hold values and not overlook accounting for different promotional mechanics.
The Product Mix: The Aggregation of “Edge”
Structural hold is a weighted average derived from the mix of handle across varying product lines (bet types). A sportsbook is essentially a portfolio of products, each with a distinct theoretical margin.
Pre-Game Singles: The Low-Margin Anchor
- Theoretical Hold: Typically 4.5%-6% range average
- While margins here are thin, this is the liquidity engine and traditional domain of high stakes action. Standard -110 lines take a 4.5% theo hold.
In-Play Singles: The Volume Multipler
- Theo Hold: 6-8% range.
- Main markets (Spread, Money Line and Totals on full game outcomes) are typically and traditionally bet to -115 both sides, equivalent to 7% take out rate. Live betting re-prices constantly and dynamically based on game state for events with data latency, and execution risk creating inefficiencies in capturing the full expected theoretical value. The real power of In-Play is frequency of events with the expansion in offerings into “Next Point, Drive, Basket” etc. micro markets creating velocity in the recycling of winnings.
Traditional Parlays: Compounding Effect
- Theo Hold: depends on leg count. More legs = higher theo. Blended average ~13-17% range.
- These independent cross game or otherwise unrelated events multiply the odds offered to you and in doing so compount the operator’s structural edge.
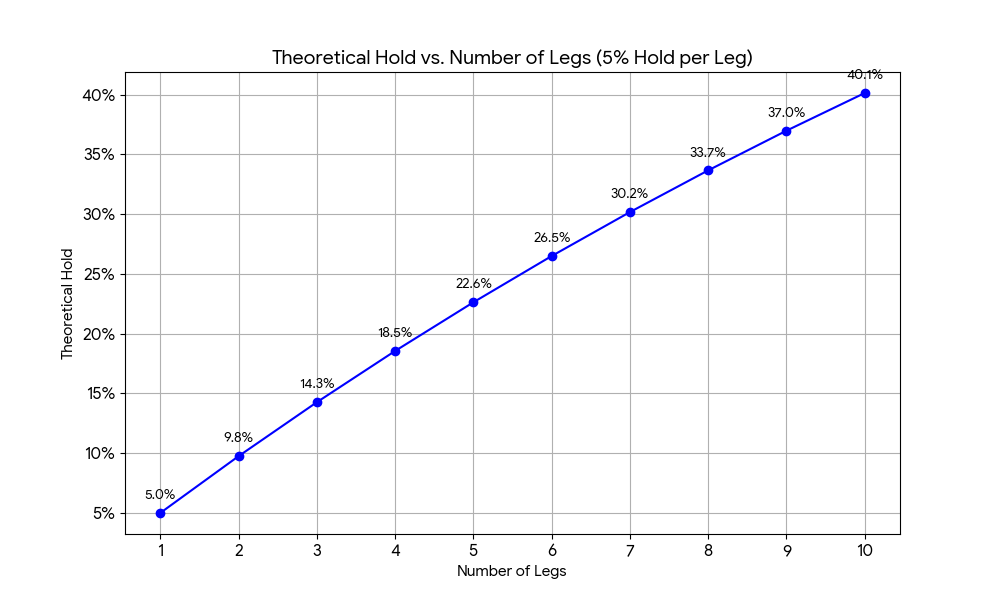
- Example: If you have a 5% theo hold on Leg A and 5% on Leg B
- Using the same Return to Player (RTP) method:
- Leg A RTP: 100% – 5% = 95%
- Leg B RTP: 100% – 5% = 95%
- Combined RTP: 0.95 times 0.95 = 0.9025
- This gives the house a theo hold of 1 – 0.9025 = 0.0975 or 9.75%.
- *Assumption being fundamental probability of each legs price are ‘fair’ estimates.
- Below is a general depiction of the combined expected hold for a bet when many 5% theo hold single leg independent selections are added into a traditional parlay.
Same Game Parlays (SGP): The “Holy Grail” of Hold
- Theo Hold: 25%+
- SGPs are the primary driver of the modern GGR growth for OSB’s. Unlike traditional parlays, where legs are independent, SGP’s involve correlation.
- The Secret Sauce: Users intuitively correlate outcomes (e.g. Chiefs to win + Mahomes Over 250 Passing Yards). Pricing models are designed to charge a premium for this correlation, which exceeds the true probability shift. With outcomes tied to a single game script, constrained by the bounds of how much scoring, yardage gained, attempts and completions can possibly occur in any one game, it is harder for a bettor to find a “positive expectation” edge across multiple variables.
- With mix of recreational handle shifting towards the SGP product (now upwards of 25% for leading operators, and more on major sports alone), this is the single biggest factor in the rise of structural GGR hold over time.
From Handle to GGR
Aggregrate OSG GGR Hold is simply a sum of these parts
- Scenario: A sportsbook takes $100M in handle.
- $50M on Singles (5% Hold) = $2.5M GGR
- $20M on Parlays (15% Hold) = $3.0M GGR
- $30M on SGPs (30% Hold) = $9.0M GGR
- Result: Total structural expected GGR in this case is $14.5M on $100M handle. A 14.5% blended hold, despite half of all handle being low margin singles.
As consumer behaviors shift toward lottery-style payouts of SGPs, structural hold improves with it.


Leave a comment