The defining feature of the U.S. online sports betting (OSB) market is not handle growth — handle was always going to come. It is the deliberate, durable expansion of structural hold from a high-single-digit ceiling toward a low-double-digit floor, achieved through product mix rather than line pricing. The mechanism is the same-game parlay (SGP). The evidence over the last two years is that this margin gain has crossed from thesis into reported earnings: the category’s two scaled operators printed their first sustained positive EBITDA against a rising structural-hold backdrop, even as customer-friendly sport outcomes injected real quarterly noise. For capital allocators, the relevant question has shifted from “will OSB be profitable” to “where does normalized hold settle, and which jurisdictions and products defend it.”
For three years after the Supreme Court struck down PASPA in May 2018, the consensus framing of sports betting — repeated in statehouse testimony from coast to coast — was that it was a structurally thin-margin business. The number operators cited was the legacy Nevada hold of roughly 5.4%. That framing was not merely descriptive; it set the terms of the tax bargain in dozens of jurisdictions. It was also, in retrospect, the single most consequential misread in the sector’s short history.
The realized national hold rate has since roughly doubled. The trajectory — from approximately 7% in 2019 to 10.15% in 2025 — is not a story of operators charging more vigorish on a coin-flip. The theoretical hold on a standard -110/-110 market is only about 4.5%. The gap between that and a reported double-digit number is almost entirely a mix story: the migration of handle, and disproportionately of revenue, into high-margin parlay products. What follows traces that migration through the regulator-reported data, with particular attention to the monthly and quarterly cadence of the last two years, where the structural signal and the outcome noise are most easily — and most dangerously — confused.
From low-margin assumption to double-digit reality
The long arc is best read annually, because it strips out the considerable within-year volatility that sport outcomes impose. On that basis the picture is unambiguous and monotonic in trend, if not in every step.
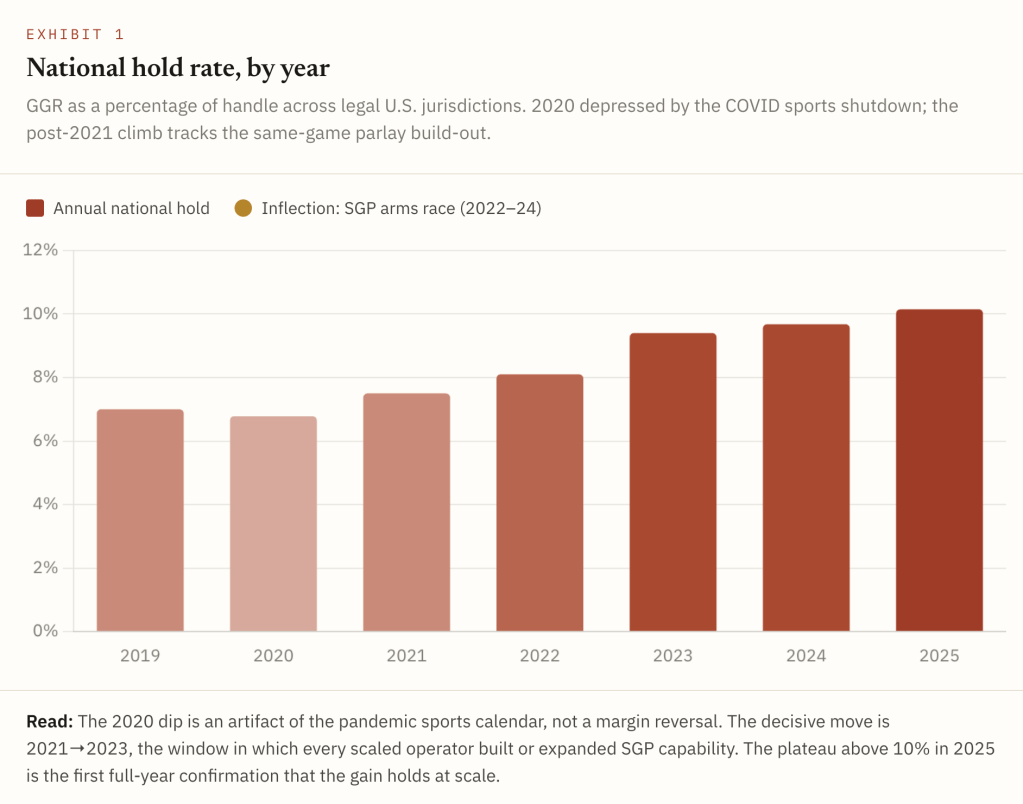
Two features of Exhibit 1 deserve emphasis for anyone underwriting the category. First, the climb is product-led: it coincides precisely with the period in which operators shifted promotional and engineering resource toward parlay construction, not with any broad repricing of straight markets. Second, the gain has proven sticky — 2024 and 2025 both held the line near or above double digits despite stretches of bettor-friendly results, which is the first real evidence that the new level is a floor rather than a peak.
Why the parlay is the entire margin story
It is difficult to overstate how concentrated the margin engine is. Most jurisdictions do not disaggregate revenue by bet type, but New Jersey — the market that started it all in 2018 — does, and its filings function as the sector’s Rosetta Stone. The contrast they reveal is stark enough to carry the entire thesis.
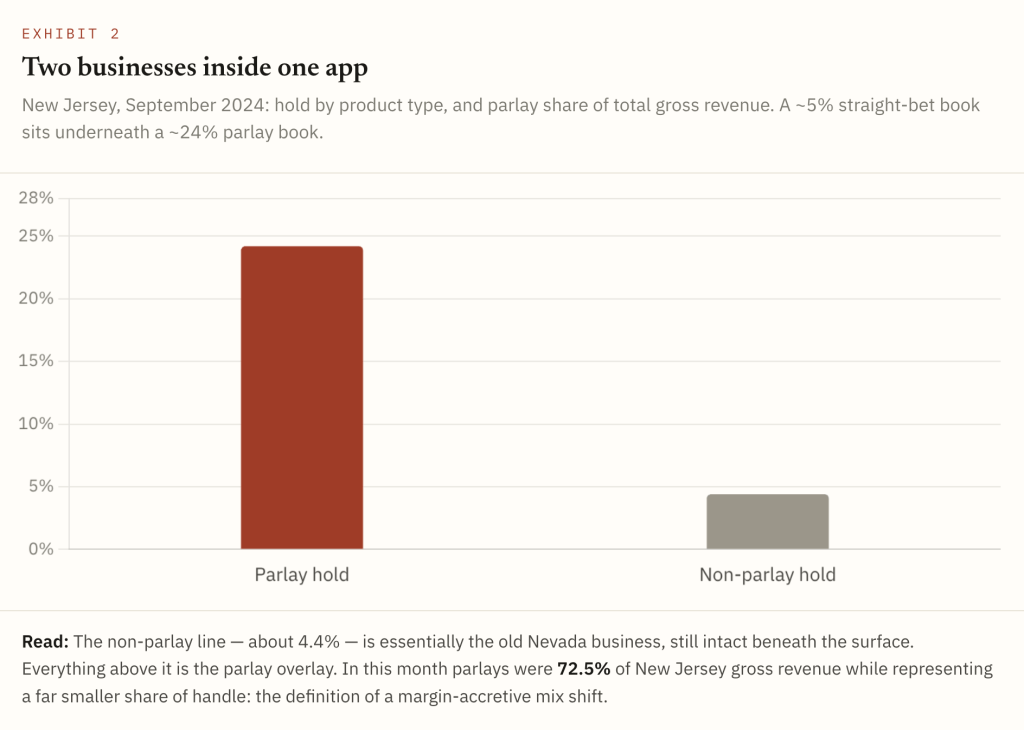
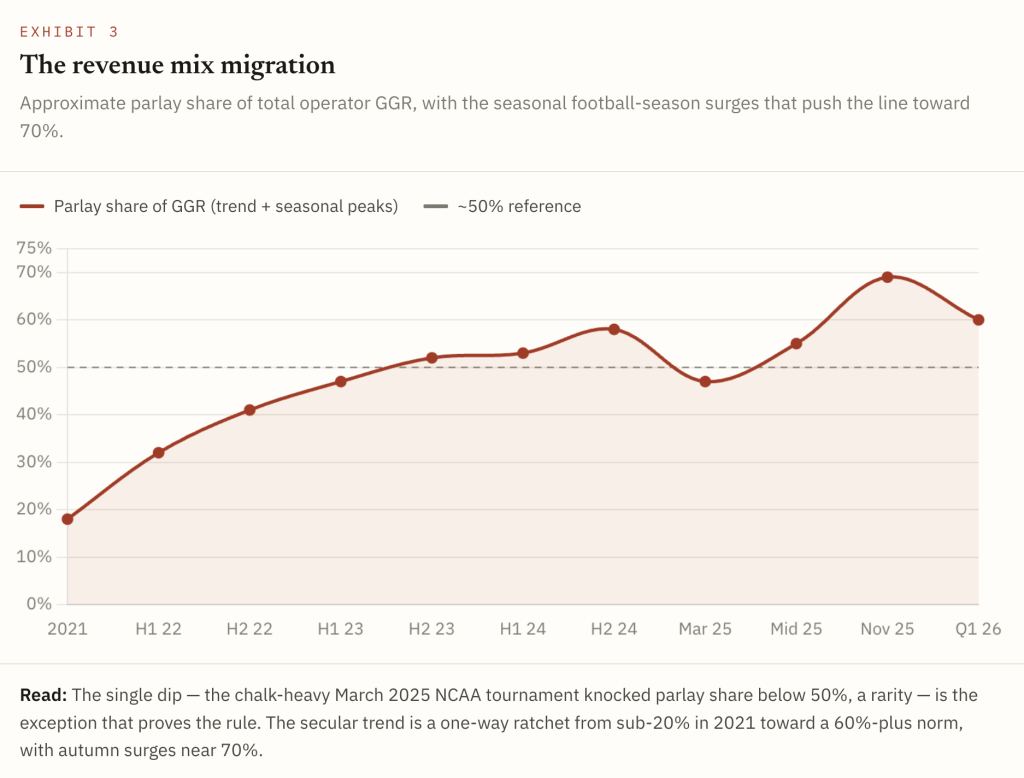
The economic logic is structural, not promotional. When a bettor combines correlated legs of a single game — a team total, a player prop, a spread — the true joint probability sits below the priced-in implied probability, and that wedge widens with each leg. The product is attractive to the customer (low stake, lottery-style upside, one-tap construction) and extraordinarily attractive to the operator (a multiple of straight-bet hold on the same dollar of handle). That dual appeal is why the category’s revenue mix has migrated so fast.
Separating the structural signal from the outcome noise
The single most important analytical discipline in this category is distinguishing structural hold — the margin operators engineer through pricing and mix — from realized hold, which is structural hold plus or minus the random walk of sport outcomes in a given period. Over a long enough window the noise washes out; over a single month or quarter it can swamp the signal entirely. The quarterly cadence of the last two years is the clearest available illustration.
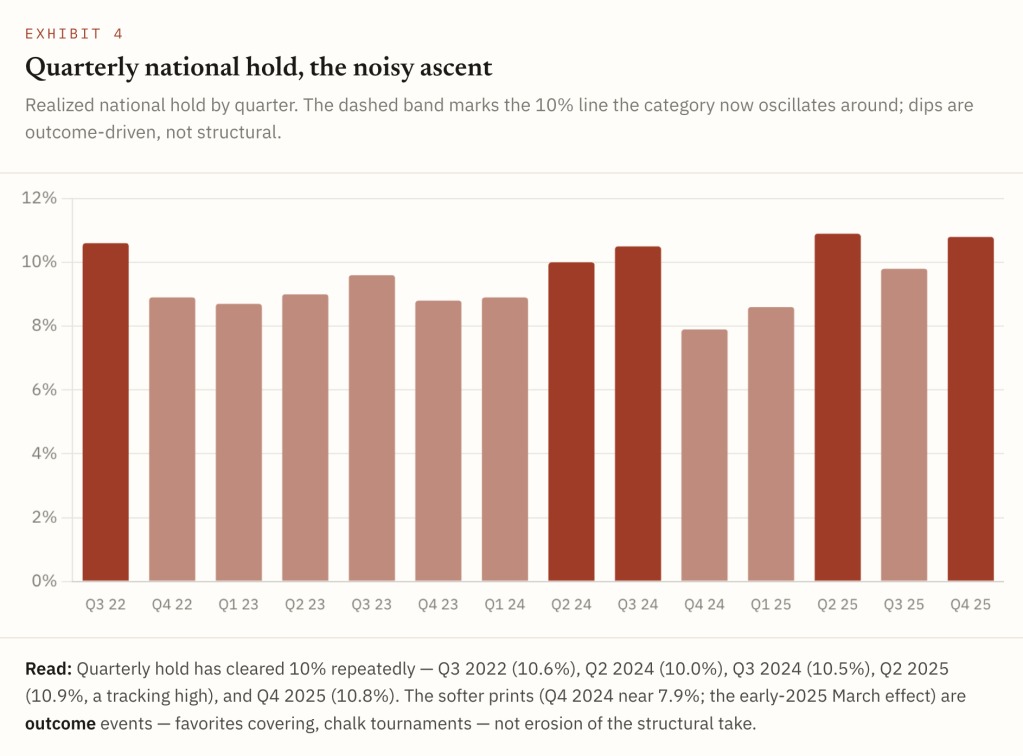
The Q4 2024 episode is the canonical case study. Realized hold sagged to roughly 7.9% not because operators repriced or because parlay adoption reversed, but because NFL favorites covered at an unusually friendly clip — public, parlay-heavy tickets cashed. Two quarters later, Q2 2025 printed an all-time tracking high of 10.9% on the mirror-image dynamic plus continued structural gains. A capital allocator who extrapolated either quarter would have drawn precisely the wrong conclusion. The correct read is the centerline, which has migrated decisively upward.
The market spent its first three years arguing about whether sports betting could be profitable. It has spent the last two proving that the answer depends almost entirely on a product category that barely existed at launch.
Structural hold reaches the income statement
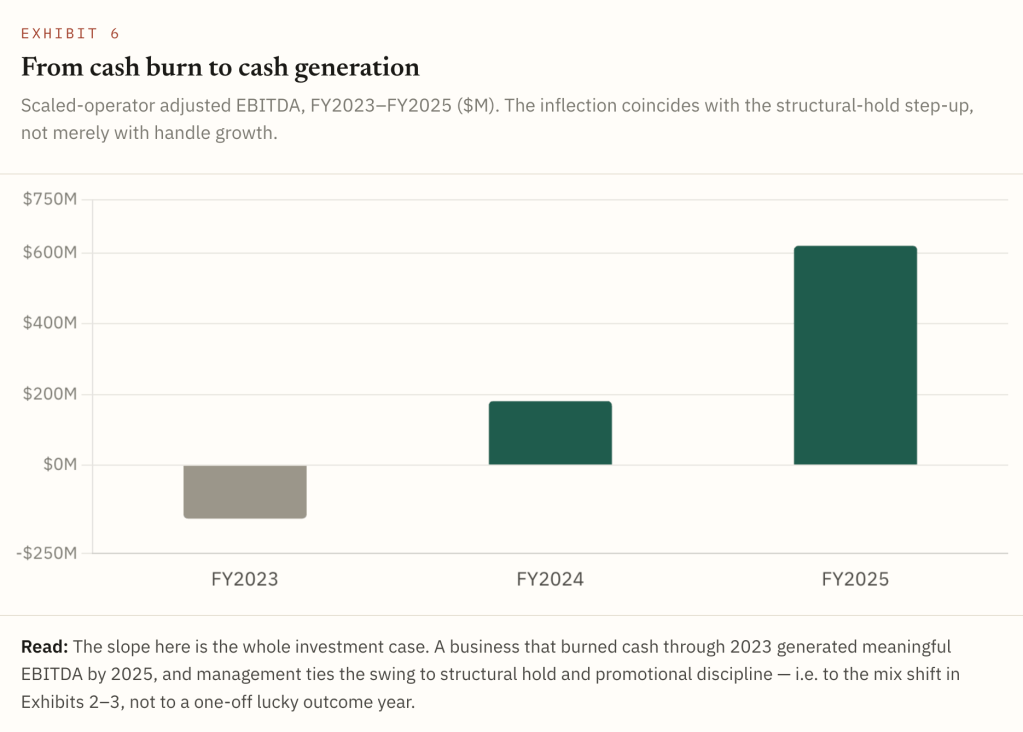
The most important development of the last two years is not in the regulator data at all — it is in operator disclosure. The margin thesis that lived in state filings has now shown up where it counts. The category’s scaled public operator turned its first full year of positive adjusted EBITDA, and the inflection is steep: adjusted EBITDA moved from negative in 2023 to modestly positive in 2024 to several hundred million in 2025, on revenue compounding past $6 billion. Management has repeatedly and explicitly attributed the gain to higher structural sportsbook hold alongside improved promotional reinvestment — the same mechanism the New Jersey filings expose, now visible in audited results.
Two operator-level nuances matter for anyone sizing the opportunity. First, structural hold is not uniform across the duopoly: the market leader has run several points of structural margin ahead of its nearest competitor in recent quarters, a gap most plausibly explained by deeper parlay penetration and more efficient promotional spend. Margin, in other words, is now a genuine point of competitive differentiation — the “quality” phase of the SGP race rather than the “capability” phase. Second, even the disclosed gains carry an outcome overlay: guidance through 2025 was nudged up and down chiefly as quarterly results ran for or against the books, which is simply the public-company expression of Exhibit 4’s noise.
The mix-and-margin story is mature enough that the interesting questions now point forward, and two stand out for capital allocation.
How high can hold climb before the customer notices?
Parlay hold itself is volatile and appears to have a practical ceiling: it spiked toward 26% in late 2021 and again near 25.8% in mid-2025, then reversed sharply both times. The likeliest interpretation is that operators discover a customer-tolerance boundary — too much realized margin too fast suppresses the recreational engagement that feeds the funnel. The base case is therefore not an indefinite climb but a settling of blended hold in a low-double-digit band, with parlay take managed below its theoretical maximum to protect lifetime value. That is a healthier and more defensible equilibrium than a pure margin-maximization read would suggest.
Do prediction markets cannibalize or extend the franchise?
The newest variable is the launch of operator-run prediction markets and event contracts, live across dozens of states including non-legalized ones, beginning in late 2025. Early analyst estimates peg direct cannibalization of sports betting at a modest 0–5%. The more interesting framing is strategic rather than defensive: prediction markets function as the new daily-fantasy playbook — a low-friction way to install apps, build customer databases, and capture payment credentials in states that have not yet legalized traditional OSB, ready to convert when they do. On that read the product is franchise-extending, not margin-dilutive, though it remains the clearest near-term source of model uncertainty.
The takeaway for an allocator is narrow and durable. U.S. OSB margin was not a happy accident of one good outcome year; it was built, product by product, and it has now been confirmed in audited earnings. The variables left to underwrite are the ceiling on blended hold, the durability of the margin gap between the two leaders, and the conversion value of prediction-market footprints — not whether the category can earn its cost of capital. On current evidence, it can.


Leave a comment