How the duopoly turned marketing scale into a structural moat — and why everyone else is spending into a glass ceiling. A data-grounded look at ad budgets, channel strategy, affiliate economics, and the fully loaded cost of acquiring a bettor across U.S. OSB and iGaming.
In the first years after the 2018 PASPA repeal, American sports-betting advertising was a land grab conducted at full volume. Operators carpet-bombed every new state with television spots, free-bet offers, and celebrity endorsements, and the spending curve went vertical: from under $25 million in 2017 to roughly $1.4 billion at the 2022 peak. Then something changed. The market consolidated, the backlash mounted, and the biggest operators — having already won — began to pull back. The story of brand and advertising in this sector is no longer about who can shout loudest. It is about who converted years of saturation spend into durable awareness, and who is still paying full price for share that will not come.
This is a comparison of leading operators that matter — FanDuel, DraftKings, BetMGM, Caesars, bet365, BetRivers, Hard Rock— across the dimensions that define brand and advertising strategy: how much they spend, where they spend it, and how efficiently that spend converts to market position.
The market: a spending curve that already peaked
The single most important fact about sports-betting advertising is that the category total is past its high-water mark. According to Nielsen research commissioned by the American Gaming Association, U.S. operators spent about $1.1 billion on advertising in 2023 — a 21% decline from the roughly $1.4 billion spent in 2022, excluding daily fantasy. The contraction continued: all-channel ad volume fell 9% in 2024 and is down 27% from the 2021 peak.
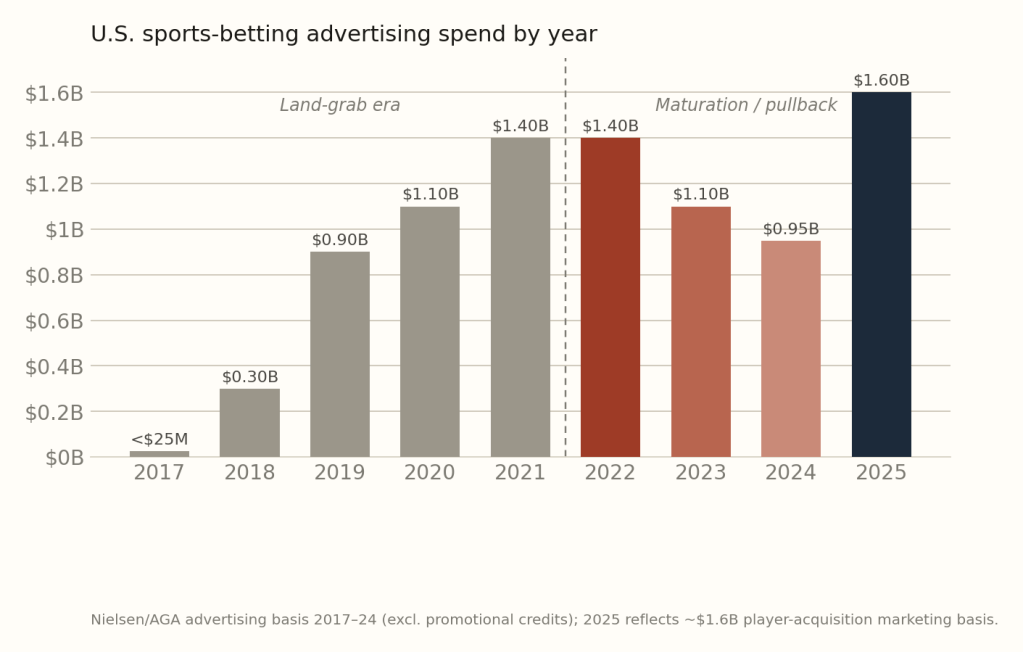
Exhibit 1 — U.S. sports-betting advertising spend by year. From under $25 million in 2017 to a ~$1.4B peak in 2022, then a deliberate pullback as markets matured. The 2025 figure reflects roughly $1.6 billion in player-acquisition marketing on a broader basis. The vertical line marks the shift from land-grab to maturation.
The reason is structural. A dozen states launched legal sports betting across 2019 and 2020; just three did across 2024 and 2025. Each new-state launch historically triggered an advertising blitz; with the map nearly complete and over two-thirds of U.S. adults already able to bet legally, the marginal new-customer-via-TV-spot has become dramatically more expensive. The leaders responded by reallocating from local saturation toward efficient national reach. To put the category in perspective: even at peak, sports betting was only about 0.4% of total U.S. TV advertising volume — for every betting ad on TV in 2024 there were roughly four telecom commercials and thirty-eight pharmaceutical ones. The perceived ad deluge was always concentrated in sports programming, not the broader media landscape.
Spend by operator: two tiers, an order of magnitude apart
When you array the nine operators by marketing spend, the defining feature is not a gentle gradient — it is a cliff. The duopoly operates in a different financial universe from everyone else.
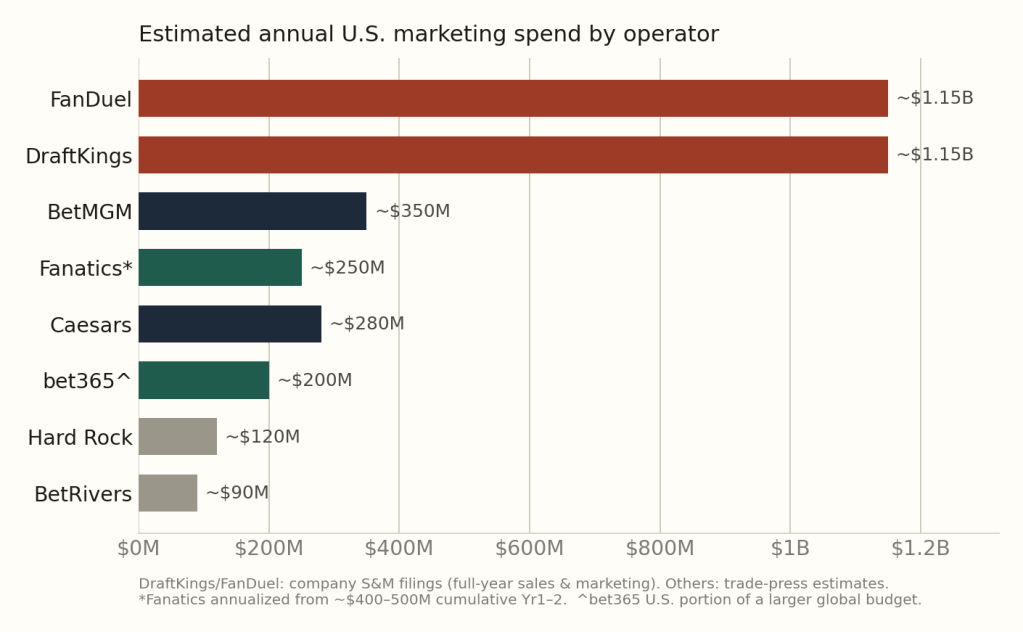
Exhibit 2 — Estimated annual U.S. marketing spend by operator. FanDuel and DraftKings each deploy well over a billion dollars a year; the entire chasing pack clusters between roughly $90 million and $350 million. This 3-to-1-or-greater spending gap is the financial engine of the duopoly’s brand dominance.
The figures, anchored to company filings where available: DraftKings’ sales-and-marketing expense ran $368.6 million in Q4 2024 alone and $442.6 million in Q4 2025, against roughly $233 million in the lighter Q2 2025 — a strongly seasonal pattern (heaviest around football season) that annualizes to roughly $1.1–1.2 billion. FanDuel, whose parent Flutter reports U.S. sales-and-marketing in the mid-teens to ~20% of revenue against a U.S. revenue base well north of $6 billion, spends at a comparable or higher absolute level — over $1 billion annually on marketing and promotion. Below the duopoly, the drop is steep. BetMGM sits near $350 million, Caesars near $280 million (dialed back sharply from its ~$1 billion launch blitz), Fanatics in the mid-hundreds of millions (annualized from an estimated $400–500 million committed across its first two years, roughly a third of it the Tom Brady creative budget), bet365 deploying perhaps $200 million of a larger global budget in its narrow U.S. footprint, and BetRivers running a deliberately lean ~$90 million regional book.
An investment source quoted in trade press framed the implication bluntly: the money the top two can spend dwarfs everyone else, creating what another called a “glass ceiling” for the rest. This is the central brand-strategy fact of the U.S. market.
Efficiency: the moat is conversion, not just scale
Raw spend tells only half the story. The more revealing metric is efficiency — how much market share each dollar of marketing buys. Plotting estimated spend against national GGR share exposes why the duopoly’s lead is so defensible: they don’t just spend more, they convert more per dollar.
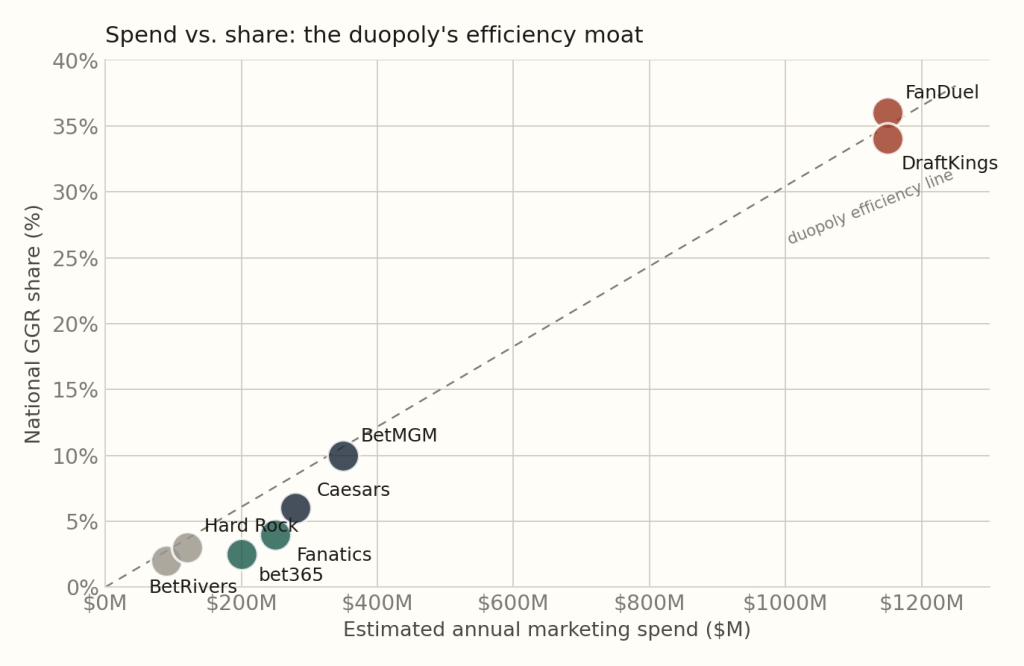
Exhibit 3 — Spend vs. share: the duopoly’s efficiency moat. FanDuel and DraftKings sit on or above the efficiency line at the top right, converting roughly $1 billion of spend into mid-thirties share. The chasing pack clusters in the bottom left, several of them below the line — spending without proportional share return.
The dispersion is the argument. FanDuel and DraftKings convert their billion-dollar budgets into roughly 36% and 34% national GGR share respectively. BetMGM sits close to the efficiency line at ~$300 million for ~10% share. But Caesars and bet365 sit clearly below it — Caesars at ~$300 million for ~6% share, bet365 at a similar spend for an estimated ~2.5% U.S. share, reflecting its narrow state footprint. The lesson for capital allocators is that in a maturing market, marketing spend exhibits sharply diminishing returns for sub-scale players: the duopoly benefits from brand flywheel effects (existing awareness lowers each new customer’s acquisition cost) that challengers, starting from lower awareness, simply cannot match dollar for dollar. This is why Flutter has historically cited an attractive ~1.2x one-year return on FanDuel’s acquisition cost while smaller operators struggle to reach profitability.
Channel strategy: the slow migration off television
Where operators spend has shifted as decisively as how much. Television was the defining medium of the land-grab era — the NFL famously caps in-game sportsbook advertising at six approved operators, making those slots fiercely contested trophy assets. But TV’s dominance is eroding.
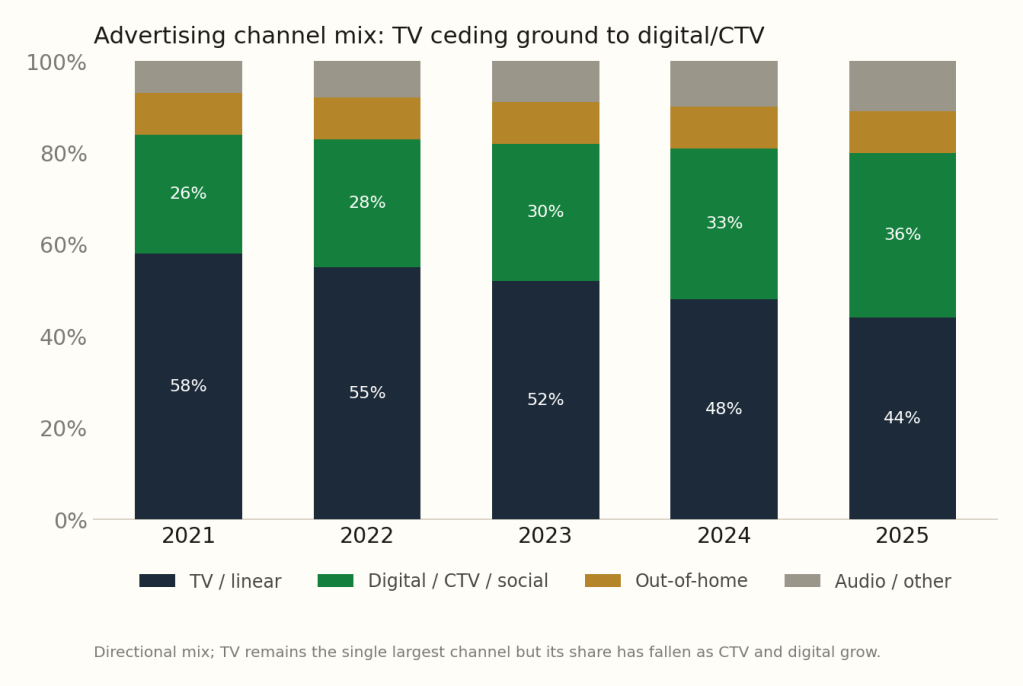
Exhibit 4 — Advertising channel mix. TV remains the single largest channel but its share has fallen from roughly 58% toward the mid-40s as digital, connected-TV (CTV), and social capture a growing slice. Out-of-home and audio hold steady.
TV advertising volume fell 17% in 2024 and is down 44% from 2021 — declining faster than the overall budget, which means its share of the mix is shrinking. The migration target is digital and connected-TV, the one channel where marketers across industries are increasing spend: a majority report planning to grow CTV budgets, prizing its targeting precision and measurability over linear TV’s spray-and-pray reach. For sportsbooks, this shift dovetails with the move from new-state awareness campaigns (well suited to broad TV) toward retention and cross-sell of existing customers (better served by targeted digital). The operators furthest along this transition — the duopoly, with their first-party data advantages — extract more value per dollar, reinforcing the efficiency gap in Exhibit 3.
A parallel structural shift is the media-partnership model. DraftKings’ 2025 NBCUniversal deal, alongside arrangements with Warner Bros. Discovery and Amazon’s Thursday Night Football, lets it reach national audiences at negotiated rates rather than buying spots at full freight. The now-defunct PENN–ESPN arrangement was the most aggressive version of this thesis: rather than rent media, embed the sportsbook inside it. Its collapse is a cautionary tale about the limits of buying brand through a media partner when the underlying product cannot retain the traffic.
The hidden channel: affiliate marketing and performance acquisition
Television and brand campaigns are the visible face of sportsbook marketing, but a large and growing share of actual customer acquisition runs through a quieter channel: affiliates. These are the comparison sites, odds portals, tipster communities, and content networks — PlayMA, the Action Network, Covers, and the publicly traded affiliate groups Better Collective and Catena Media (now part of a consolidating set) and GDC America — that funnel ready-to-deposit bettors to operators in exchange for performance-based commissions. For challenger brands especially, affiliates are not a supplement to the ad budget; they are frequently the most cost-effective acquisition engine available, precisely because they shift acquisition risk off the operator’s balance sheet.
The economics divide into three models, and the choice between them is one of the most consequential decisions an operator’s growth team makes.
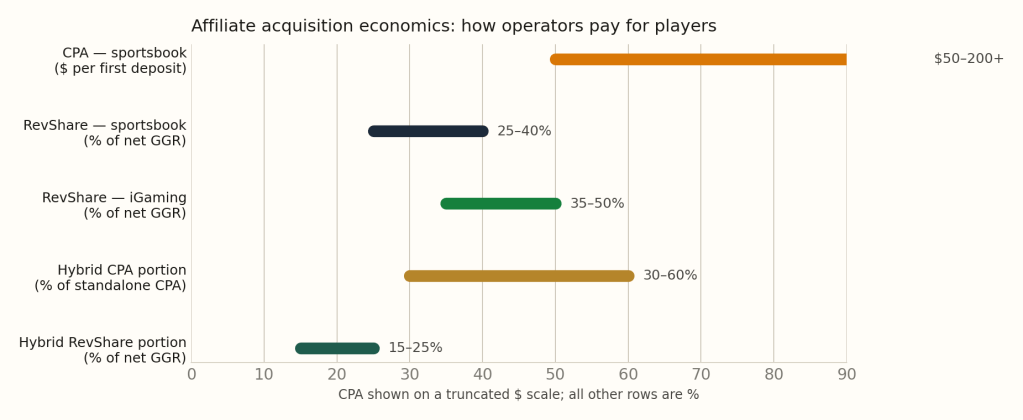
Exhibit 5 — Affiliate acquisition economics. The three commission structures and their typical ranges. CPA pays a fixed bounty per new depositor; revenue share pays a percentage of the player’s net losses over their lifetime; hybrid blends a smaller upfront fee with an ongoing cut.
Under CPA (cost per acquisition), the operator pays a fixed bounty — typically $50 to $200 or more per first-time depositor — the moment a referred customer funds an account. CPA suits operators with strong internal models of player lifetime value who can absorb the upfront cost and prefer predictable unit economics; it shifts all subsequent revenue risk onto the operator, since the affiliate is paid the same whether the player churns immediately or stays for years. Under revenue share, the affiliate instead earns a percentage of the net gaming revenue the referred player generates over time — typically 25–40% of GGR for sportsbook, notably lower than the 35–50% common in iGaming because sportsbook margins are structurally thinner. Revenue share aligns incentives toward player quality and creates, in the words of one affiliate executive, an “expanding snowball” of recurring income — but it exposes the affiliate to negative months when bettors win. Hybrid deals split the difference: a reduced upfront CPA (often 30–60% of the standalone rate) plus a trimmed revenue share (15–25%).
The strategic migration in this channel mirrors the broader market’s maturation. Better Collective, the largest listed affiliate, deliberately shifted from a largely CPA-based model toward revenue share, building a base of recurring income that now represents the majority of its revenue (roughly 72% rev-share, versus a more CPA-weighted mix at Catena Media). The logic is the same one driving operators’ own shift from acquisition to retention: in a maturing market, the durable value is in the long tail of a loyal player’s lifetime revenue, not the one-time bounty of a signup.
A critical regulatory wrinkle shapes where and how this channel operates. Several states scrutinize or restrict revenue-share affiliate arrangements on responsible-gambling grounds — the concern being that paying affiliates a cut of player losses creates an incentive to drive vulnerable or high-loss customers. Massachusetts, in particular, became an industry flashpoint when regulators weighed capping or barring rev-share, prompting the largest affiliates to lobby collectively for a CPA-plus-rev-share compromise. This regulatory variability means an operator’s affiliate strategy is not uniform nationally; it is a state-by-state patchwork, which further advantages the large operators with the compliance infrastructure to navigate it.
The real cost of a customer: promo, media, and affiliates combined
The headline ad-spend figures in Exhibit 2 understate total acquisition cost, because they typically exclude the single largest line item: promotional credits — the bonus bets, deposit matches, and “no-sweat” tokens dangled to convert a signup into a funded, active player. When operators and analysts speak of customer acquisition cost (CAC), they mean the fully loaded sum of media spend, affiliate commissions, and promotional inducement required to land a retained customer. Flutter, notably, defines its FanDuel acquisition cost to include “marketing and associated promotional spend,” and reports payback — the time for a player’s gross profit to repay that cost — as the metric that actually governs investment decisions.
This fully loaded lens explains the duopoly’s moat more completely than media spend alone. Three forces compound in their favor. First, brand flywheel: high existing awareness means a larger share of their signups arrive organically or via cheap branded search, lowering blended CAC. Second, data-driven targeting: years of first-party behavioral data let them spend promotional and digital dollars on the customers most likely to be retained, raising payback. Third, promotional discipline from a position of strength: because they are not fighting for awareness, FanDuel and DraftKings have been able to reduce promotional intensity even as they grow — DraftKings explicitly cites “improved promotional reinvestment” as a margin driver — whereas sub-scale challengers must keep bonusing aggressively just to stay visible. The result is the efficiency dispersion of Exhibit 3: the leaders convert a fully loaded acquisition dollar into far more retained lifetime value than the chasing pack, and the gap widens rather than narrows as the market matures.
Operator-by-operator brand positioning
FanDuel — The awareness leader. Built on its daily-fantasy heritage, FanDuel pairs the category’s largest budget with the highest unaided awareness and a parlay-forward, value-driven brand voice. Its marketing increasingly emphasizes retention over acquisition, a sign of a brand that has already won the awareness war.
DraftKings — The co-leader, and arguably the more media-integrated of the two. Its Boston-built, founder-led brand leans on a vast DFS database for efficient acquisition and a growing roster of national media partnerships. The NBCUniversal deal signals a strategy of locking in premium reach as the market nationalizes.
BetMGM — The most spend-efficient challenger, riding the MGM Resorts brand and its “King of Sportsbooks” positioning anchored by the Vegas Strip association. Its loyalty cross-sell to physical casinos is its sharpest brand differentiator, though product reputation has plateaued.
Caesars — The cautionary tale of over-spend. Its ~$1 billion launch blitz (the J.B. Smoove “Caesar” campaign) bought awareness but not durable share, and the subsequent pullback to ~$300 million reflects a hard lesson about the diminishing returns of brand-by-brute-force.
Fanatics — The most strategically distinctive brand. It converts an enormous merchandise customer base and the FanCash rewards loop into a sportsbook funnel, jersey-drop campaigns tie betting to fandom. Its parent’s $31 billion valuation and league equity stakes give it a brand halo no other challenger can replicate at scale.
bet365 — The product brand. Globally dominant and beloved by sharp bettors for its app and pricing, but a deliberately restrained U.S. marketing posture and narrow footprint cap its domestic awareness. Its brand equity is real but concentrated among informed users, not the mass market.
BetRivers (RSI) — The regional specialist. A lean budget focused on localized TV and digital in core states, with the iRush loyalty program as its retention hook. It competes on efficiency and niche depth rather than national presence.
Hard Rock — The brand-name play. It leverages one of the strongest consumer names in entertainment and a Florida monopoly, but its competitive-state presence and awareness remain concentrated rather than national.
ESPN BET — The instructive failure. PENN bet that ESPN’s media brand and audience could be rented into sportsbook share; despite the strongest media hook the category ever had, it consistently undershot targets, and the brand is now being wound down and migrated to theScore Bet. Proof that brand borrowed from a media partner cannot substitute for a retaining product.
What the data says about the next phase
Three conclusions follow from the evidence. First, the advertising arms race is over, and the duopoly won it — the category’s total spend has peaked, and the leaders are shifting from acquisition to retention from a position of entrenched awareness. Second, spend efficiency, not spend volume, now separates the field; sub-scale operators face sharply diminishing returns, which is why several spend at or below the efficiency line and why one investment source said he struggles to see how anyone challenges the top two. Third, the channel mix is migrating toward targeted digital and CTV, rewarding the operators with the first-party data to exploit it — again, disproportionately the leaders.
The strategic question for the chasing pack is no longer “how do we outspend the duopoly” — they cannot — but “where can a differentiated brand find defensible niche equity”: Fanatics in fan-commerce crossover, bet365 in product-led sharp loyalty, BetMGM and Caesars in casino cross-sell, BetRivers in regional depth. The awareness war’s main front is settled. The remaining battles are for the flanks.
Sources & method: Advertising and marketing-spend figures for the public operators are anchored to company filings — DraftKings’ quarterly sales-and-marketing line (e.g. $368.6M in Q4 2024, $442.6M in Q4 2025, ~$233M in Q2 2025) and Flutter/FanDuel’s reported U.S. sales-and-marketing as a percentage of revenue — supplemented by Nielsen research commissioned by the American Gaming Association, MediaRadar and iSpot.tv tracking, and trade reporting (Sportico, Sports Handle, Casino.org, iGaming Business). Affiliate commission structures and ranges are drawn from industry sources (AffPapa, Track360, iGB, CDC Gaming) and reporting on Better Collective, Catena Media, and the Massachusetts Gaming Commission’s rev-share deliberations. Market-share figures are approximate, synthesized from fragmented state-regulator monthly reports; Fanatics, bet365, and Hard Rock are privately held, so their spend and share figures are trade-press estimates and should be read as order-of-magnitude. Spend figures blend total sales-and-marketing and advertising-only bases across sources; the affiliate and channel-mix exhibits are directional. For research and discussion; not investment advice.


Leave a comment